Project 01 · Full-stack research software
Solar Observer: Space Weather Monitoring Dashboard
2026 - Present
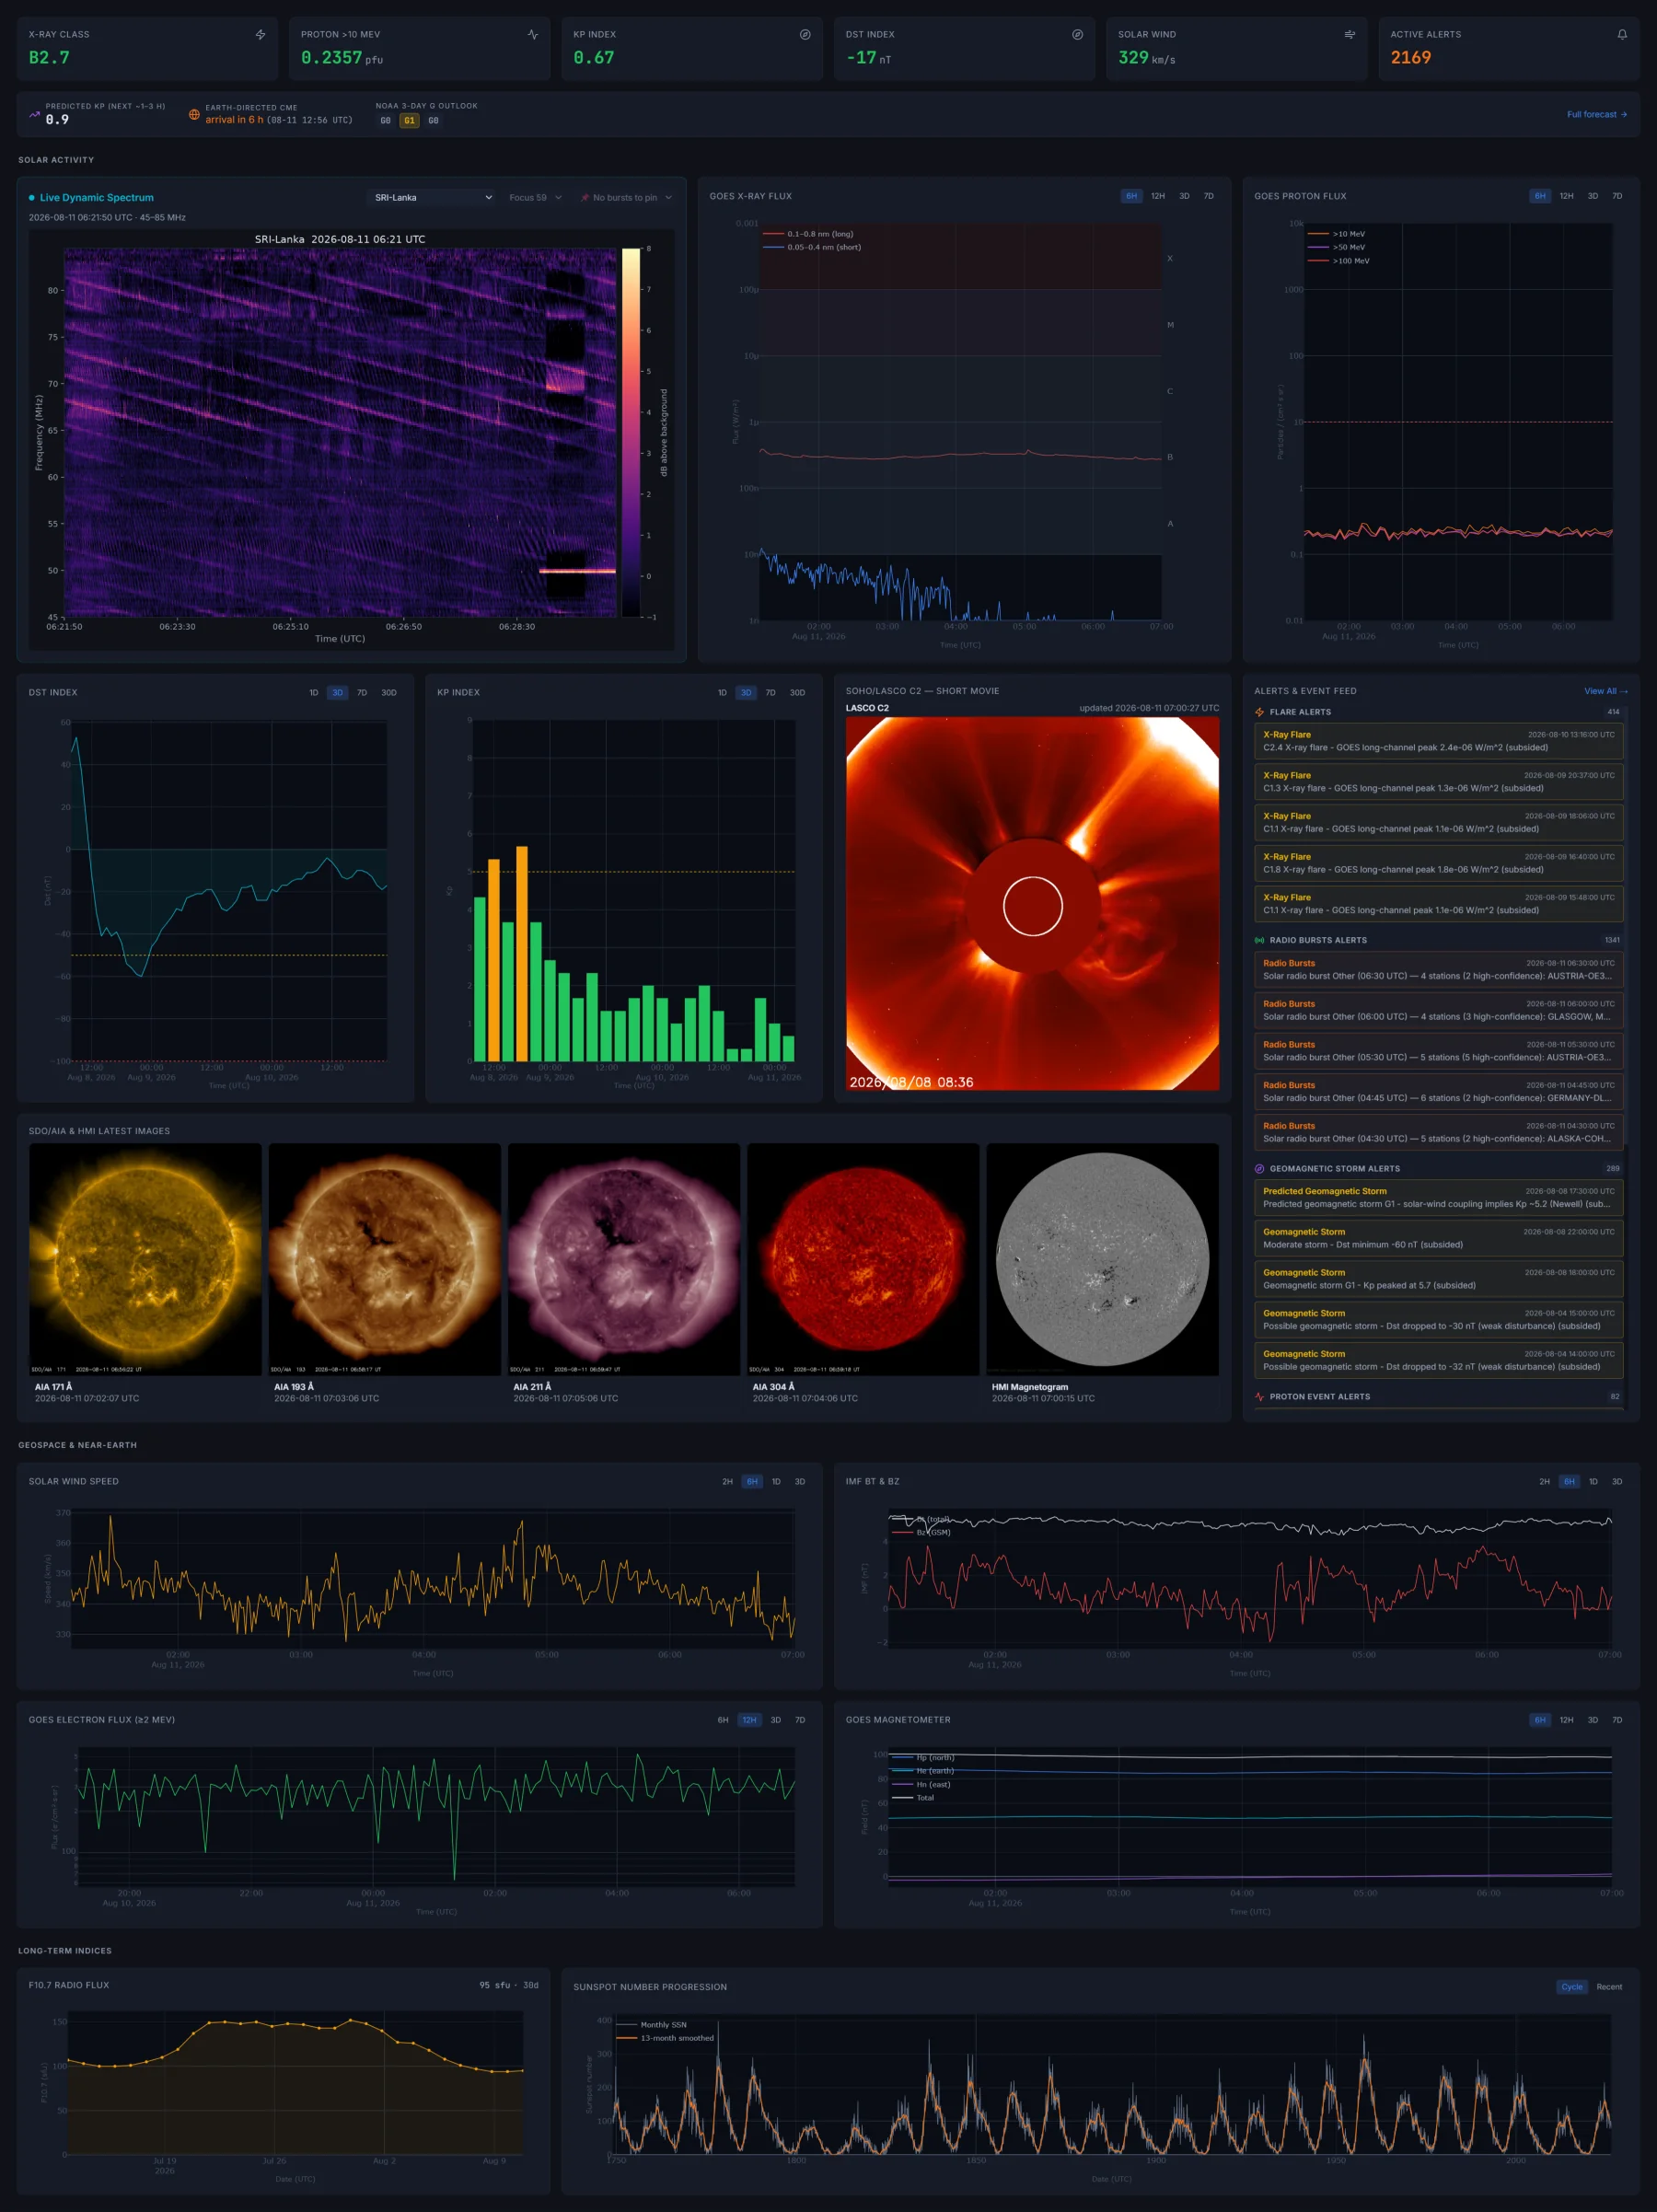
A full-stack dashboard that combines solar-radio spectra, X-ray and proton flux, solar imagery, geomagnetic indices, and solar-wind measurements in one event-monitoring and archive-search environment.
Interactive system tour
Inside the monitoring workspace
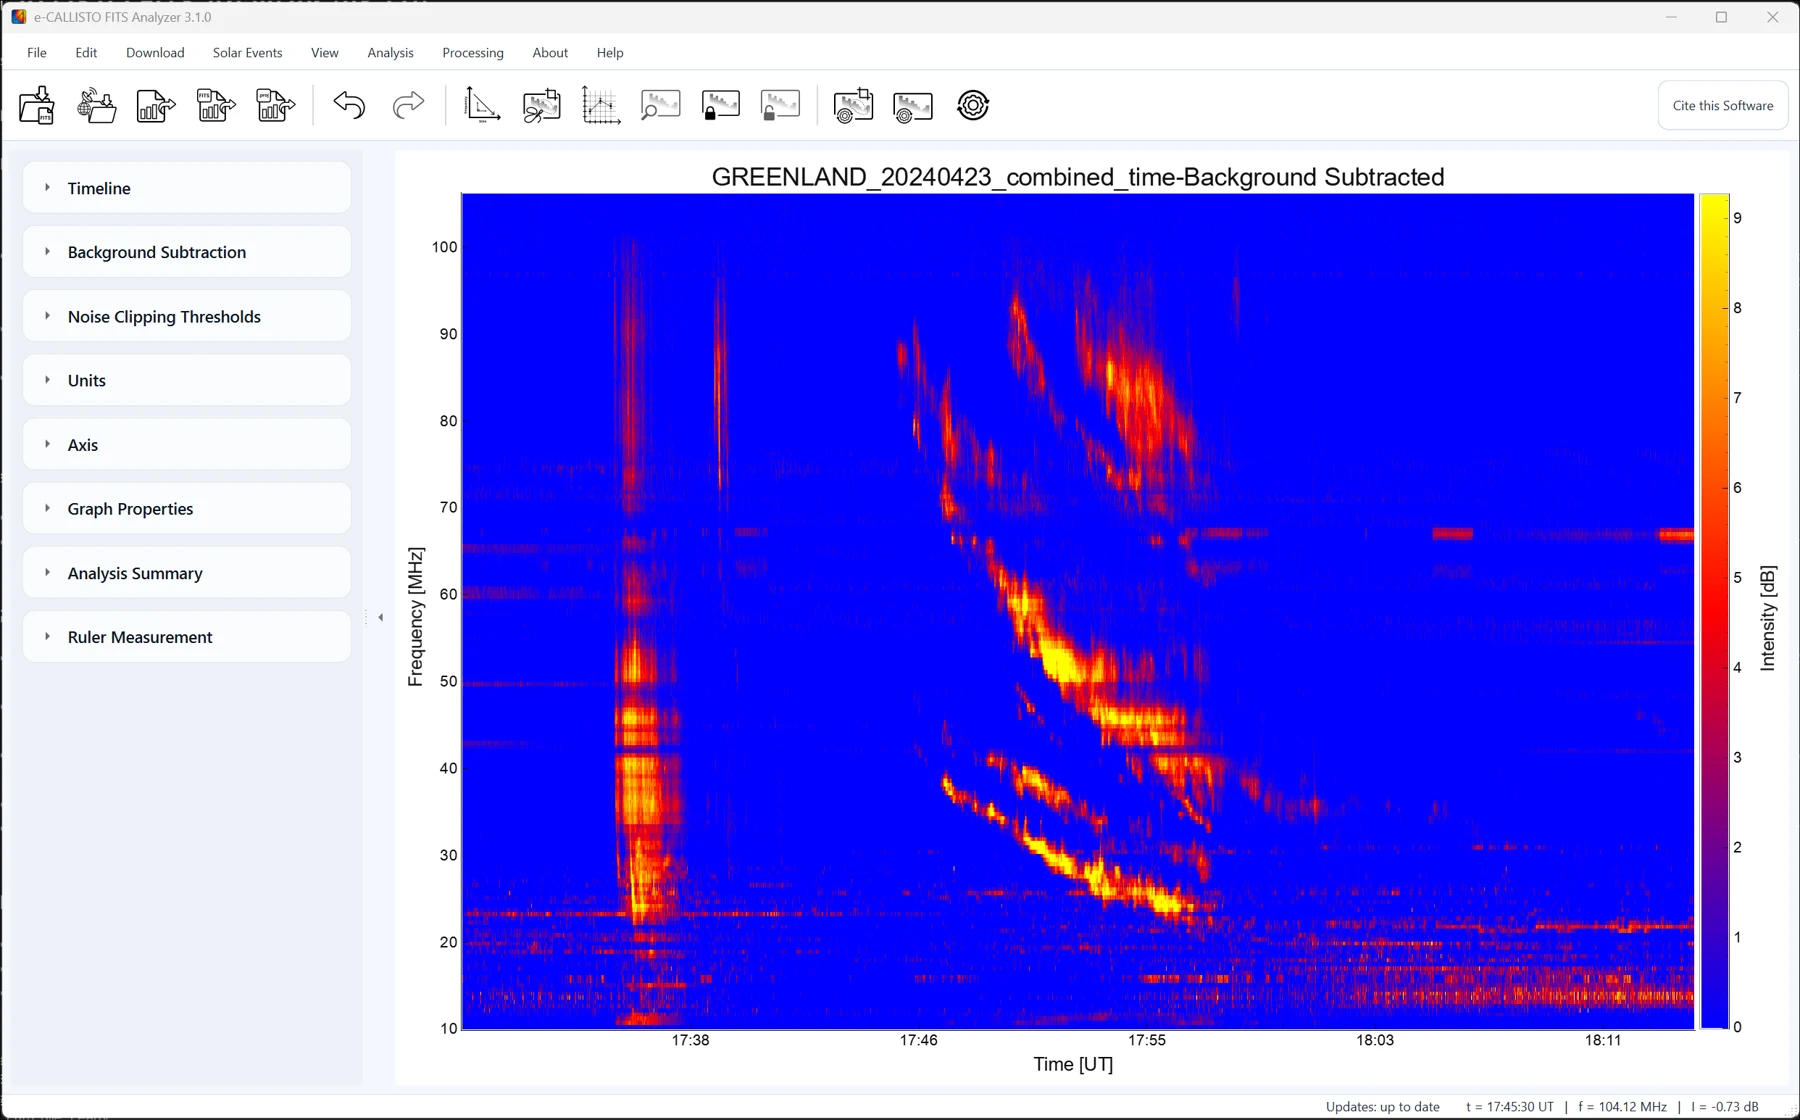
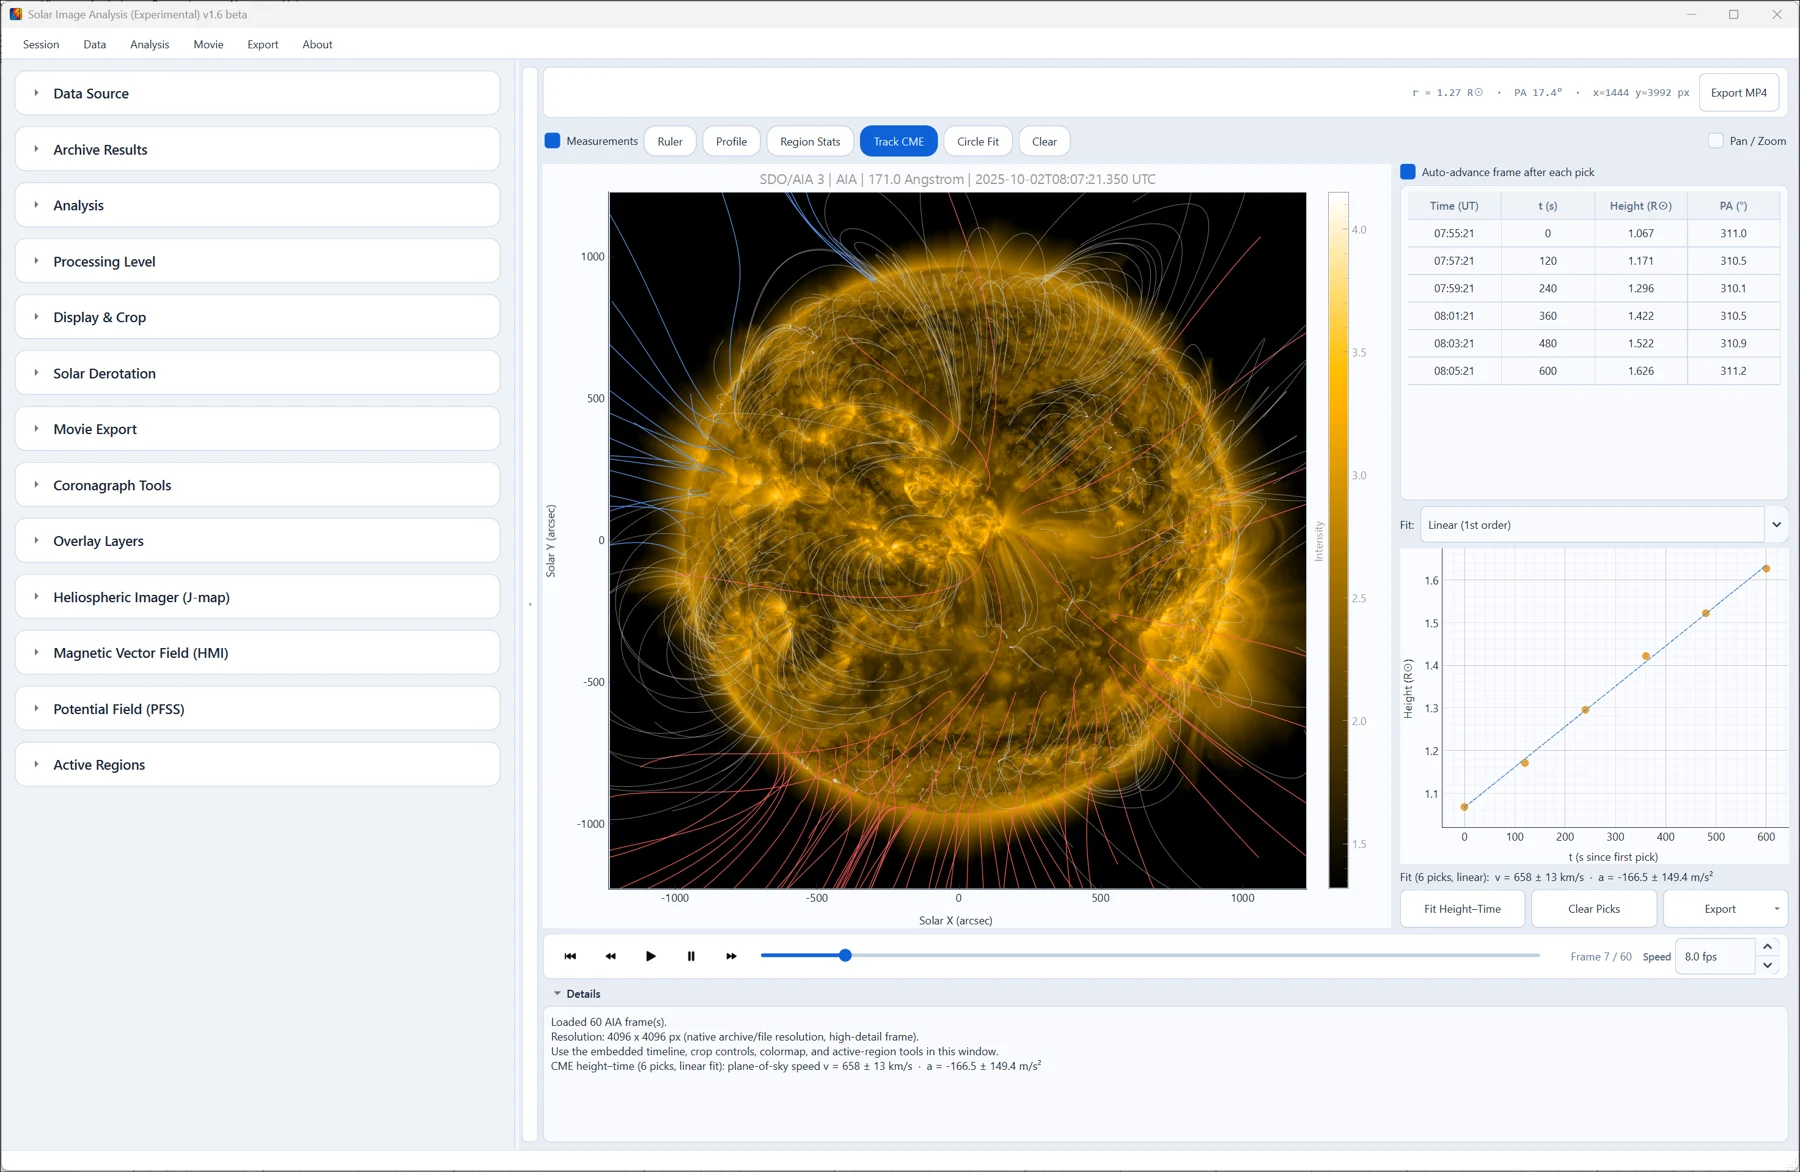
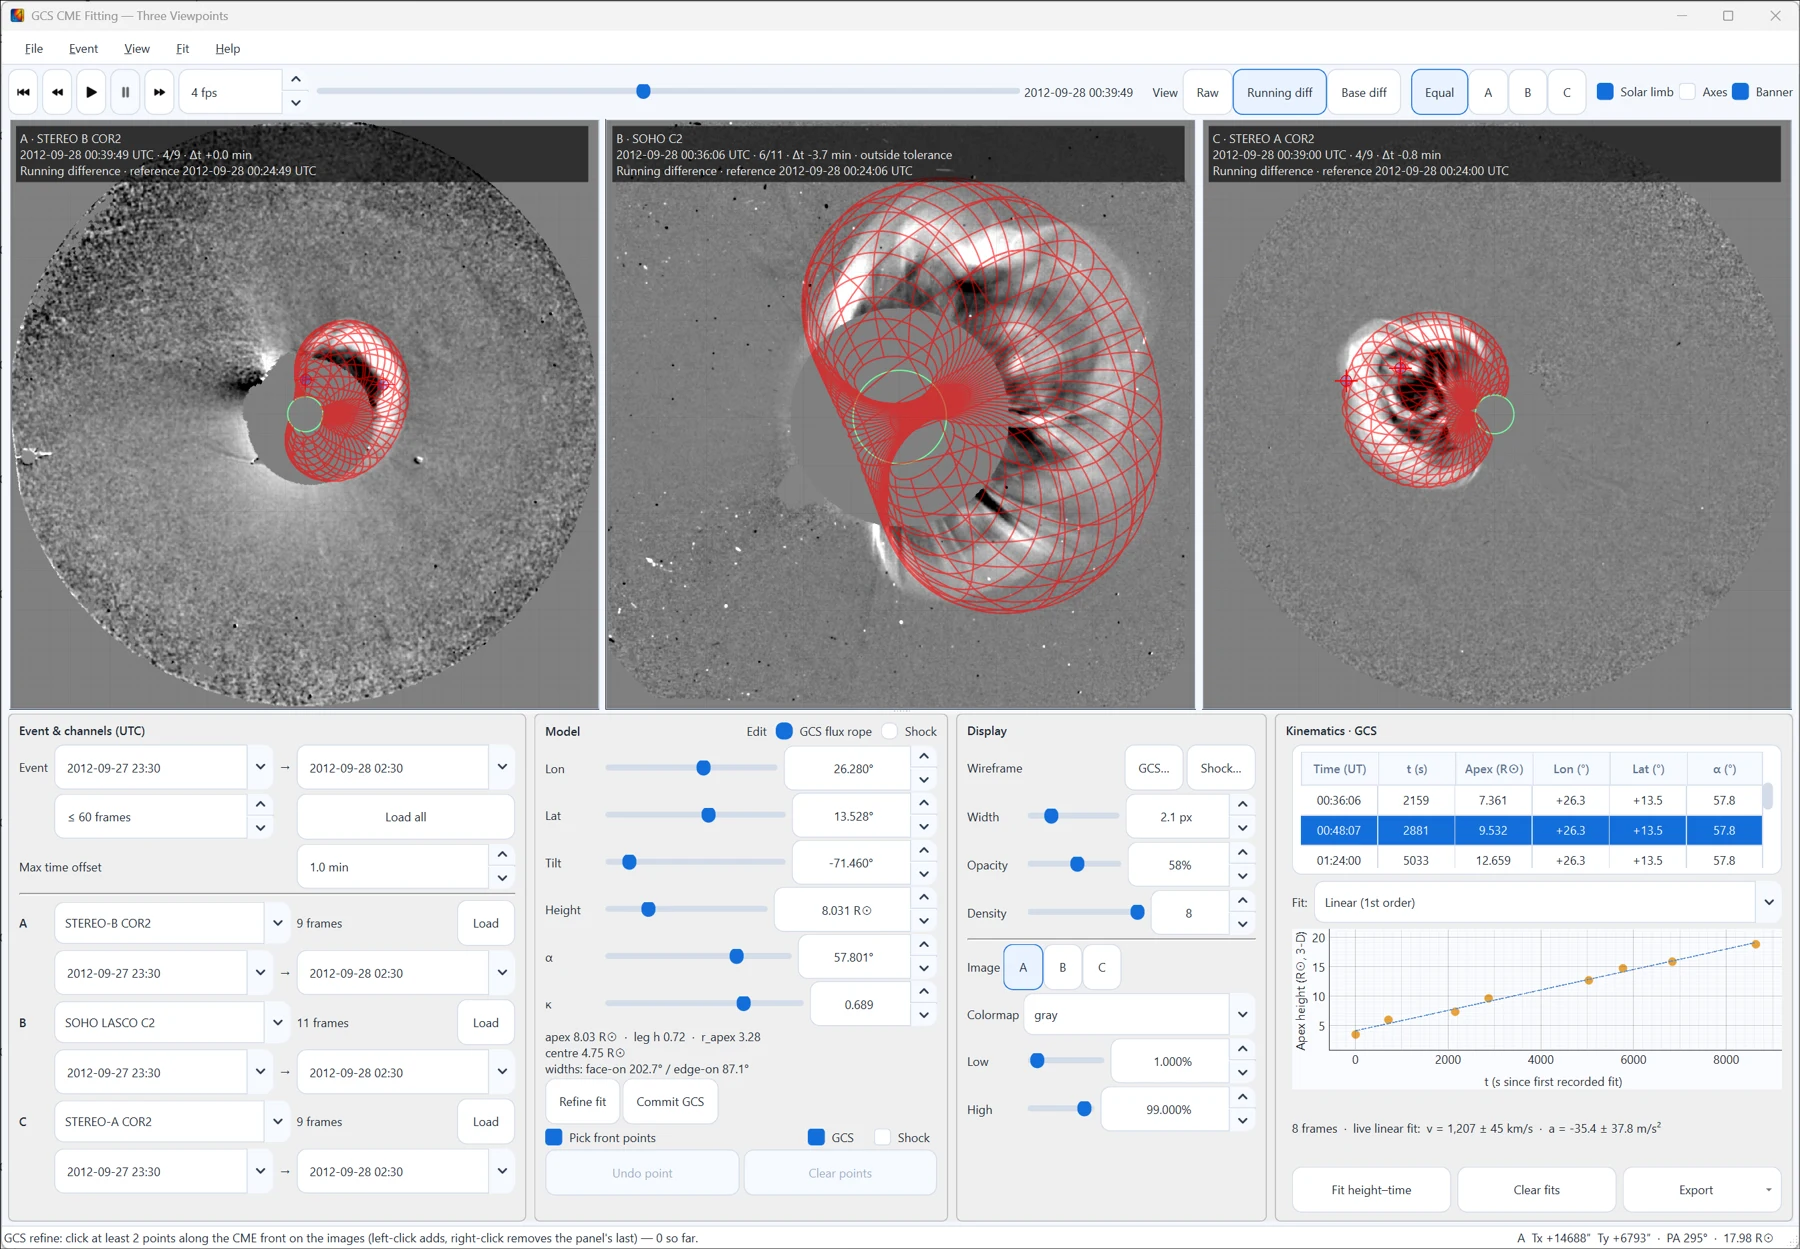
Six connected views bring live monitoring, scientific analysis, forecasting, and historical context into one research environment.
System views
Scientific background
Space-weather interpretation often requires evidence from several instruments and data services. This project brings those streams together with alerts, a combined event timeline, and archive search so solar activity can be reviewed as a connected sequence rather than as isolated plots.
Research questions
- How can complementary solar and geospace measurements be monitored in a coherent event timeline?
- Can machine-learning models detect and classify radio bursts reliably enough to assist expert review?
- How can current observations and historical data be made accessible through the same interface?
Data or experimental methods
- e-CALLISTO dynamic spectra
- GOES XRS and proton-flux measurements
- SDO/AIA and HMI imagery
- SOHO/LASCO C2 and C3 coronagraph frames
- Kp, Dst, solar-wind, and interplanetary magnetic-field parameters
Analysis methods
- ResNet-18 burst-detection and three-class burst-typing models
- Next.js 14, TypeScript, Tailwind CSS, Plotly.js, and ShadCN UI
- FastAPI, Python 3.11, Pydantic v2, Astropy, NumPy, SciPy, and Pandas
- PostgreSQL with TimescaleDB, Redis, PyTorch, and Docker Compose
Verified findings
- The burst-detection classifier achieved a test F1 score of 0.932.
- The Type II, Type III, and Other classifier achieved 0.966 validation accuracy with a macro F1 score of 0.889.
- The dashboard integrates event alerts, a combined timeline, and archive search across the monitored data streams.
Current statusActive development.
Collaborators & supervisorsDeveloper: Sahan S Liyanage.